

1. Economic slowdown, but not yet a recession
Each economic cycle goes through four broad phases and differs in terms of duration and scale.

*Source: Fidelity Institutional Insight, The Business Cycle Approach to Asset Allocation.
Source: UOB PFS Investment Strategists.
We are currently in the slowdown phase, where economic activity and corporate earnings slow while monetary policy tightens to combat high inflation. We now expect a recession to be a high risk in 2024 as economic indicators have not deteriorated as quickly this year as expected. While global trade and manufacturing are showing signs of slowing, the labour market remains strong, and this has supported consumption demand and the services sector. These factors point to an extended slowdown phase.
Source: Fidelity Institutional Insight, The Business Cycle Approach to Asset Allocation.
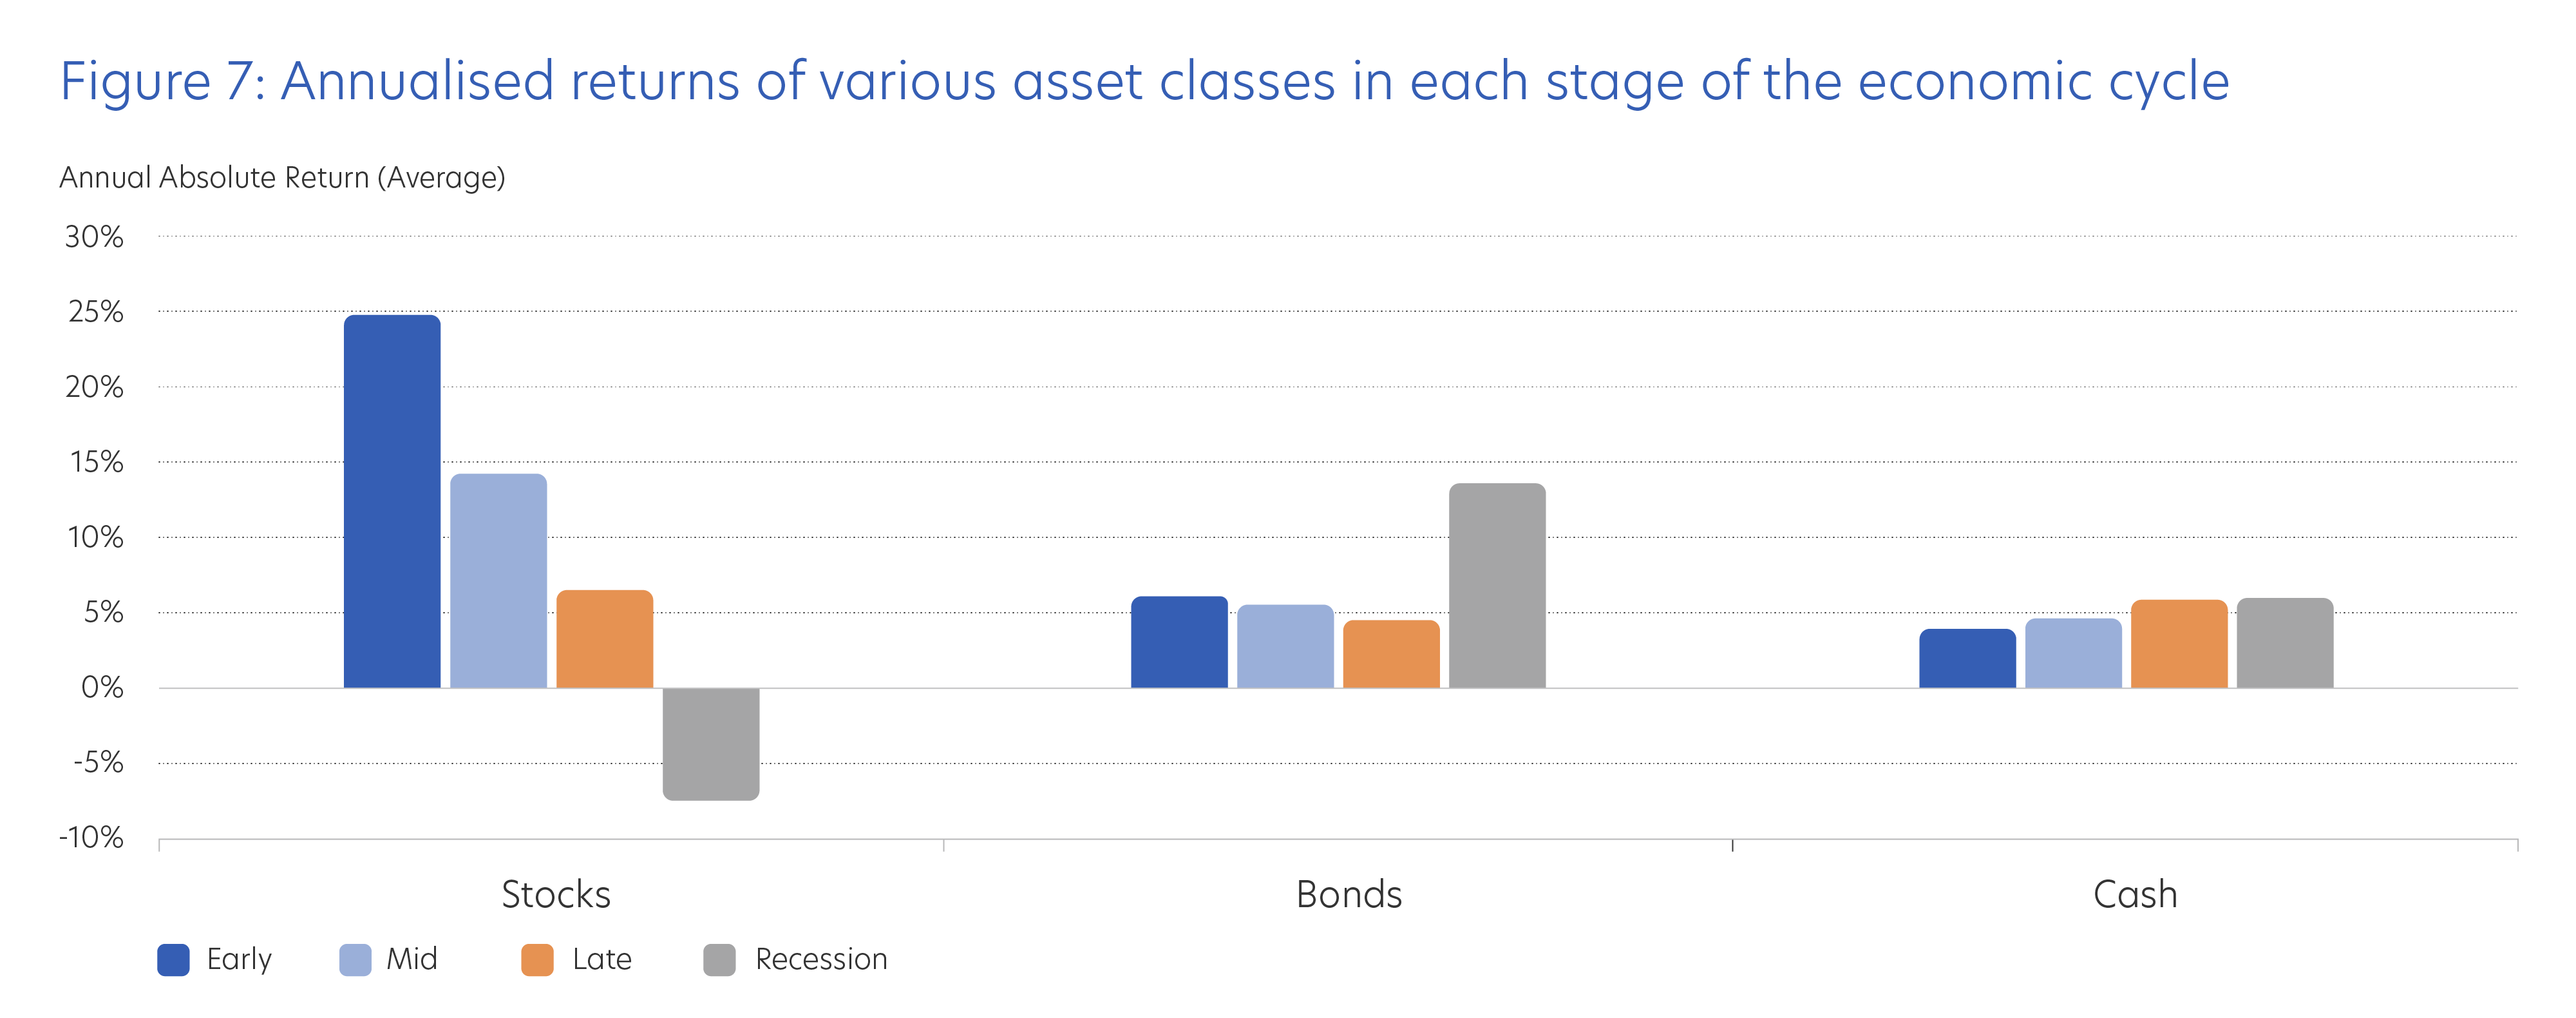
Stock market volatility rises in the slowdown phase but returns remain positive on average as seen in Figure 7. Bonds see mixed performance while returns from cash become attractive.
During this time, focus on diversifying portfolios and locking in higher bond yields. There will be opportunities in undervalued quality growth stocks on corrections. Be selective and avoid concentration risks. Do not chase rallies as well.
2. Decoupling of economies is a worrying trend
Decoupling of global economies and desynchronisation of global financial markets is a topic that is increasingly being discussed. This happens when economic conditions and market performance in different parts of the world move out of step with one another.
In recent years, we see more economies moving away from the multi-decade trend of globalisation towards decoupling because of growing economic inequality, social instability, and geopolitical tensions.
Examples of decoupling include trade protectionism between the US and China arising from geopolitical tensions, as well as sanctions placed on Russia because of the war in Ukraine. This is now an era where countries pursue economic security by imposing trade and investment restrictions on others. Figure 8 shows how global trade flows have peaked in the current era of decoupling.
Interestingly, recent events suggest that the US is now less of a free trade champion of the world as it was previously, using national security as the basis for trade restrictions and supply-chain “de-risking”. This in turn has disrupted global supply chains, with the US encouraging companies to shift production operations back onshore or to allied countries. On the other hand, China has increasingly called for global inclusivity.
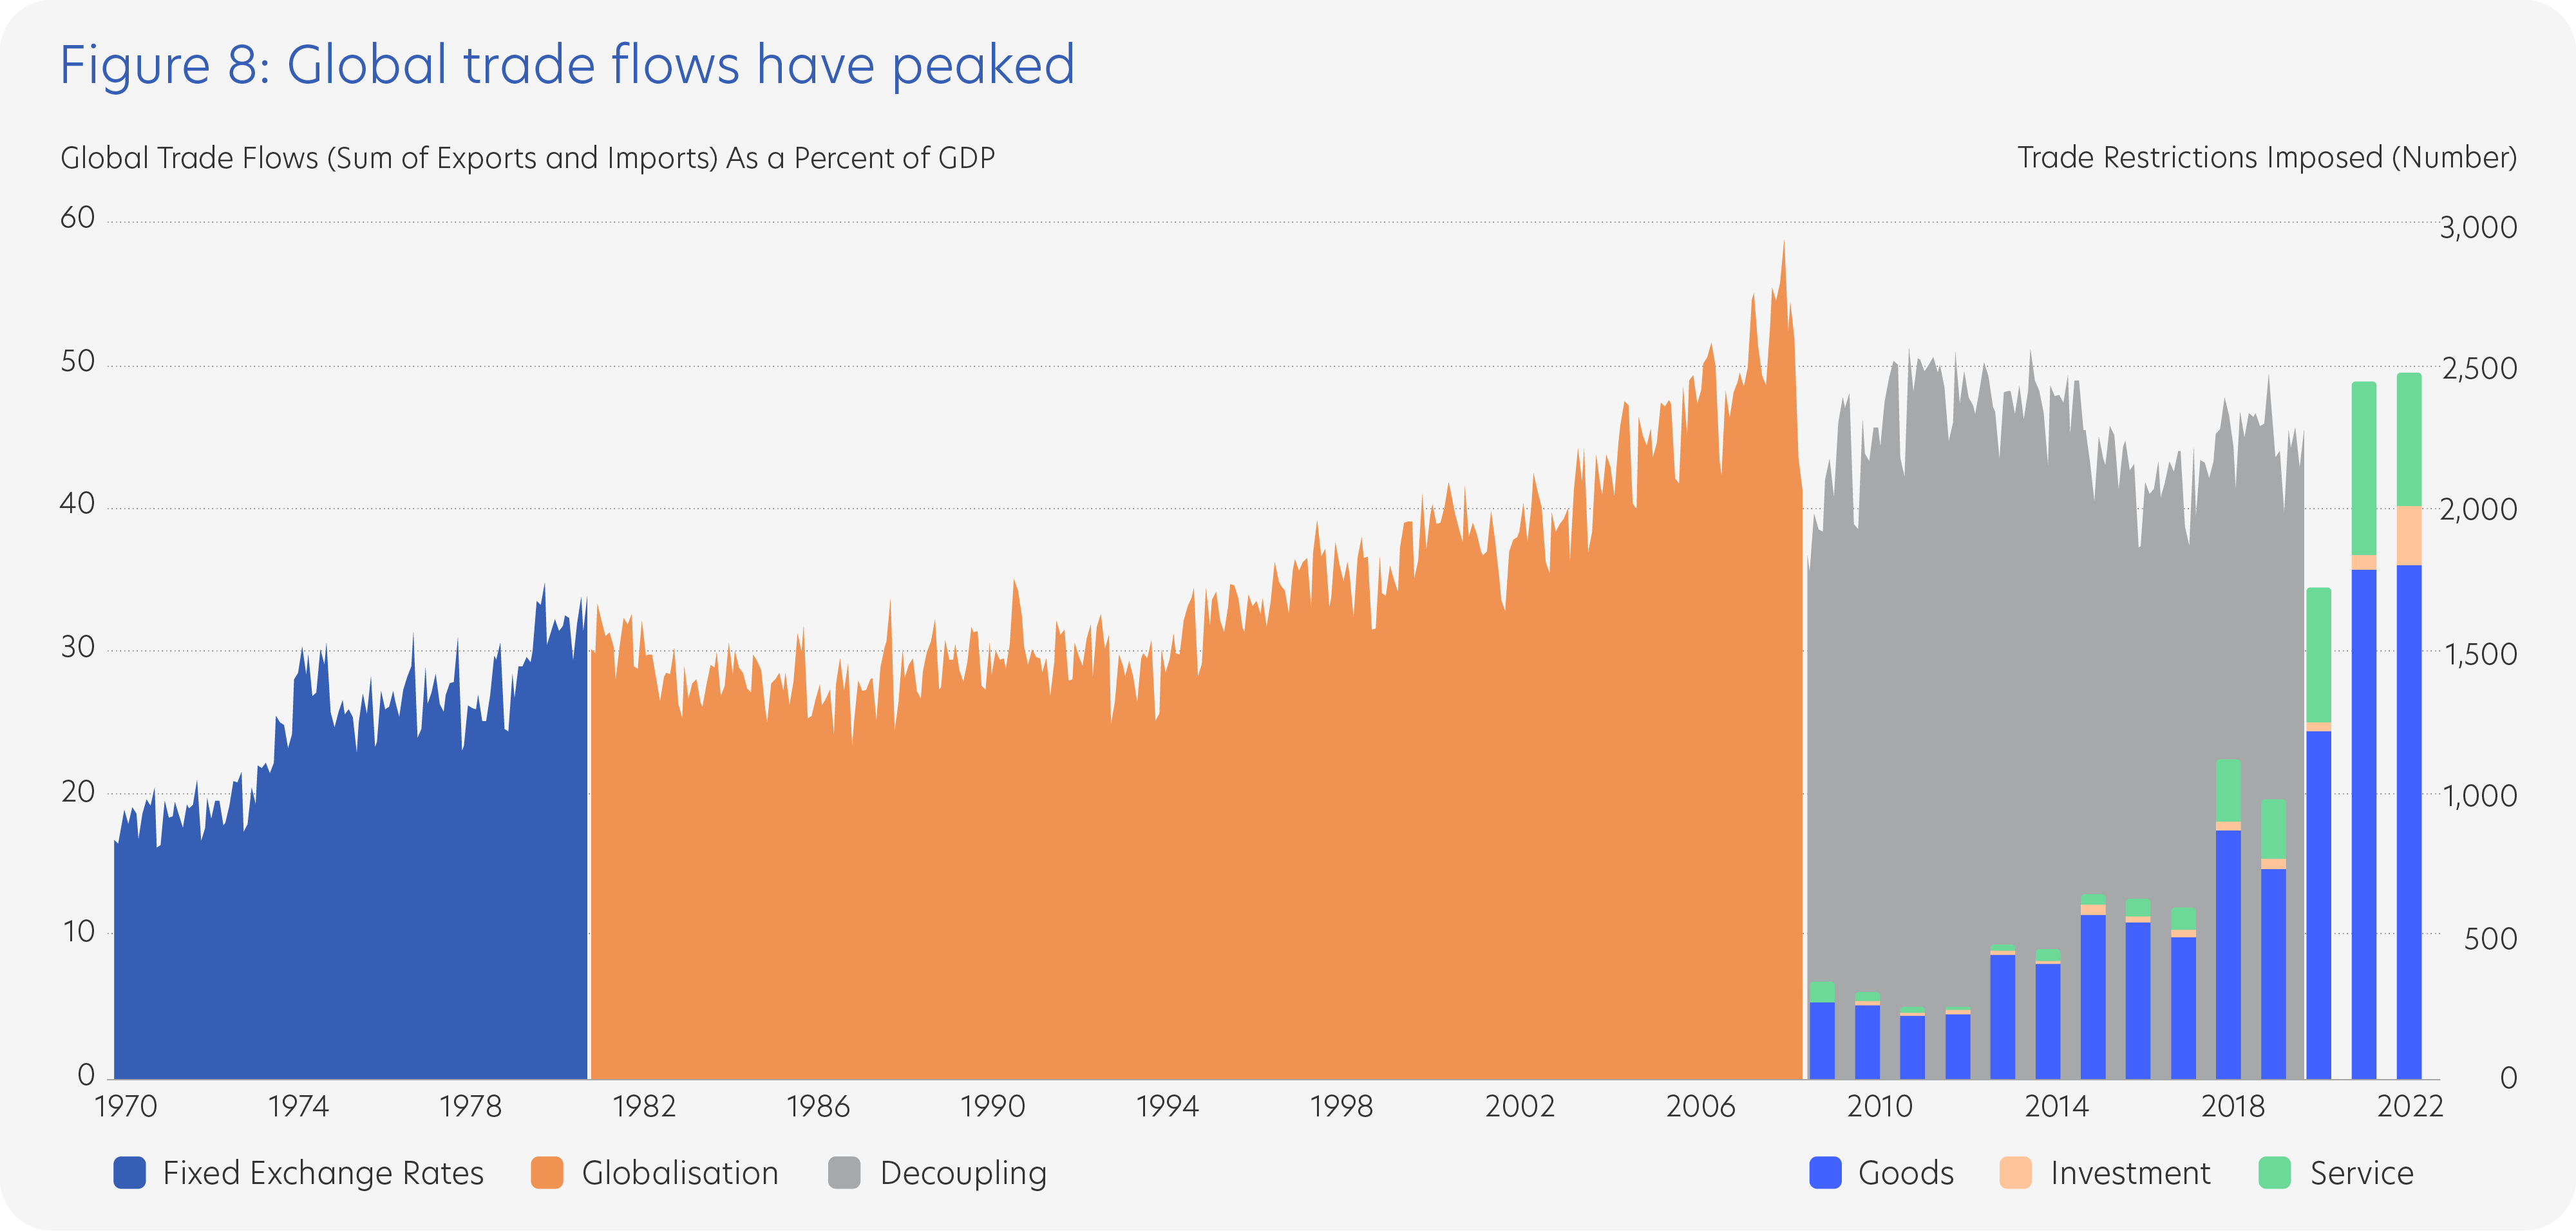
Source: Goldman Sachs Asset Management and Macrobond (27 March 2023).
Different economic policies also result in diverging economic cycles. In addition, rapid technological advancements also impact different industries and countries in different ways. We are also faced with the prospect of two different sets of technology standards, with the US and its allies excluding China from 5G technology and restricting access to high-tech semiconductors.
These trends and geopolitical rifts could result in a world divided into three distinct blocs; a western alliance headed by the US, a China-Russia bloc, and an assortment of neutral countries comprising Latin American countries and ASEAN nations.
Economic decoupling between the US and China could negatively impact growth in both the western alliance and the Chinese camp. On the other hand, neutral countries may benefit from being free to trade with either side.
| Western alliance | ||
| Sectors | Reasons | |
| Most impact | Food processing, agriculture sectors | Difficulty in substituting imports domestically. |
| Least impact | Clothing, electronics sectors | Domestic substitution for Chinese imports. Primary electronics producers are in the Western alliance. |
| China-Russia bloc | ||
| Sectors | Reasons | |
| Most impact | Electronics, manufacturing, and automotive sectors | Limit in supply of high-tech semiconductors, and onshoring of manufacturing activity. |
| Least impact | Services, mining, and agriculture sectors | Big domestic market, and ability to source from neutral countries. |
| Neutral countries |
| May benefit from being free to trade with either side. |
Divergence of economic growth between Developed Markets and Emerging Markets and impact on different sectors
Divergence of economic growth between Developed Markets and Emerging Markets and impact on different sectors
Since the onset of the COVID pandemic and subsequent economic re-opening, real GDP across the US, Eurozone, Asia-Pacific, and Latin America have been closely correlated. However, this may not continue for reasons stated above. We could instead see economic growth revert to the desynchronisation trend seen between 2010-2020![]() .
.
Latest International Monetary Fund (IMF) World Economic Outlook projections suggest a growth divergence between Developed Market (DM) economies and Emerging Market (EM) economies. Specifically, EM economies are expected to outperform over this year and next, as more benign inflationary pressures have allowed EM central banks to wind down policy tightening, while DM central banks still must keep rate hikes on the table given elevated inflation. A younger demographic and increasing urbanisation are additional tailwinds for EM.
| IMF World Economic Outlook Projections | ||
| 2023 | 2024 | |
| Global | 2.8% | 3.0% |
| DM Economies | 1.3% | 1.4% |
| US | 1.6% | 1.1% |
| Euro Area | 0.8% | 1.4% |
| Japan | 1.3% | 1.0% |
| UK | -0.3% | 1.0% |
| EM Economies | 3.9% | 4.2% |
| EM Asia | 5.3% | 5.1% |
| China | 5.2% | 4.5% |
| India | 5.9% | 6.3% |
| EM Europe | 1.2% | 2.5% |
| Latin America | 1.6% | 2.2% |
| Middle East | 2.9% | 3.5% |
| Africa | 3.6% | 4.2% |
Source: IMF World Economic Outlook: A Rocky Recovery (April 2023).
Divergence in inflation and monetary policies between Developed Markets and Emerging Markets
Divergence in inflation and monetary policies between Developed Markets and Emerging Markets
While inflation across DM and EM economies have mostly eased lower in tandem, price pressures in Asia are lower in comparison.
Lower inflation has allowed Asian central banks like the Monetary Authority of Singapore (MAS), Bank Indonesia (BI), Reserve Bank of India (RBI), Bank of Korea (BOK), Bank Negara Malaysia (BNM), and Bangko Sentral ng Pilipinas (BSP) to pause their rate hike cycles earlier. The Bank of Thailand (BOT) is expected to join the rate pause camp ahead.
Pausing the rate hike cycle reduces the risk of a policy mistake and self-inflicted severe recession.
Stock market divergence between Developed Markets and Emerging Markets
Stock market divergence between Developed Markets and Emerging Markets
Analysing 12-month forward price-to-earnings (P/E) ratios, EM valuations remain attractive compared to more richly valued DM markets.
| EPS growth 24mth | 12mth forward P/E | 12mth forward ROE | |
| DM | 7.0% | 17.9x | 14.8% |
| US | 9.8% | 20.8x | 17.8% |
| EM | 10.9% | 13.3x | 11.4% |
| EM Asia | 16.7% | 14.5x | 10.3% |
Source: MSCI World Index used as proxy for DM, MSCI USA Price Return USD Index used as proxy for US, MSCI Emerging Markets Index used as proxy for EM, MSCI EM Asia Index used as proxy for EM Asia.
With EM likely to see higher earnings per share (EPS) growth over the next 24 months, we should see a narrowing of the return on equity (ROE) gap between DM and EM, which in turn should allow EM valuations to rise.
In general, EM stocks tend to outperform that of DM during periods of slowing growth and high inflation, with 2000 and 2001 being good reference points. From 2000 to 2001, annual global growth fell from 4.5% to 2.0% while annual global inflation rose from 3.4% to 3.8%. During this period, annual returns of EM stocks outperformed that of DM peers by more than 12%![]() .
.
In the near-term, EM stocks could face headwinds, but the above factors suggest a positive mid-term outlook. In addition, EM bond valuations will also benefit from benign inflation and an earlier pause in the EM rate hike cycle.
3. China’s uneven economic recovery
There are reasons to be cautious about China’s economic outlook in the short run, but the medium-term outlook remains positive.
Taking a step back, it should not be a surprise that China’s recovery is uneven, and that manufacturing activity and outbound trade start to slow as external demand weakens. Domestic demand on the other hand, is primarily centred on tourism and services spending.
After nearly three years of COVID restrictions and on-off lockdowns, it has been difficult for businesses and households to heal from COVID “scars” and a meaningful recovery in business and consumer confidence will take time. Traditional economic support drivers such as infrastructure spending and property investments are also no longer picking up the slack. Provincial government finances are weakened by low land sales while private property developers face cash flow troubles. This is reflected by the waning momentum of China’s economic recovery.
The negatives:
a. Slowing trade and manufacturing
After rebounding from the December low, China’s official manufacturing purchasing managers’ index (PMI) has now eased lower over March to May and returned to contractionary territory amid softening external demand.
The export recovery has also faded, while import demand has been weak. In 2023, we expect China’s exports to decline 3.0% year-on-year and imports to only grow 2.0% year-on-year.
b. Record high youth unemployment
While China’s overall jobless rate has edged down to 5.2%, youth unemployment has risen to a record high 20.8%. Fresh graduates not finding jobs is a concern. With an estimated 11.6 million graduates expected to enter the labour market in the coming months, youth unemployment will continue to climb.
There is also a skills mismatch in the short-term that will reduce labour force productivity. Specifically, China’s re-opening is benefitting low-end services companies, with fewer job openings for higher educated graduates.
To combat this, China’s State Council unveiled a plan to boost employment of new graduates by expanding recruitment in state-owned enterprises (SOEs) and providing hiring subsidies to small and medium-sized enterprises (SMEs). Given time, hiring numbers will rise when business sentiment improves, especially if China retains a pro-growth policy stance.
Looking more broadly, if the overall unemployment rate continues to fall and employment indicators within PMI surveys continue to recover, household income should rebound with a slight lag.
c. Geopolitical tensions, COVID infections, and tightening liquidity
US-China tensions have been elevated since the start of 2023, and it is unclear if bilateral relations will improve significantly now that high-level communications have been re-established following US Secretary of State Antony Blinken’s visit to Beijing.
A resurgence of COVID infections may also impact economic growth negatively in the short-term as production activity declines due to increased employee absenteeism. However, this impact should quickly wane when the COVID wave subsides.
Tighter global liquidity could also depress China’s domestic credit growth and put companies and corporate profits under even more pressure.
d. Potential repeat of summer power shortages
A potential drag on economic growth in the early part of 2H 2023 may come from a second straight summer of severe heat, threatening a repeat of last summer’s power shortages. This could trigger power rationing, forcing factories to shutter production and disrupt supply chains.
In 2022, China’s industrial production declined over July and August when power restrictions were imposed on various manufacturing hubs along the Yangtze River. The affected industries produced materials, such as electronic components, chemical products, aluminium, steel, non-ferrous metals, polyester, and textiles.
China’s State Grid Energy Research Institute has already warned that central, eastern, and southwestern provinces in China are likely to experience electricity shortages during a heat wave, and power supply may be tight across the entire country.
The saving grace is that China has prepared by ramping up coal production, reducing the risk of a protracted nationwide power crisis. However, in the long-term, China will need to solve the structural problem of power investments lagging electricity consumption growth.
e. Property sector needs more support for confidence to return
Property sales across China had a strong start to 2023, and home prices rebounded slightly in most cities over the first four months of the year. The recovery, however, has slowed, with existing home prices in 100 Chinese cities falling from May due to concerns about the economic outlook and financing concerns.
Sentiment in the property sector may take longer to fully recover, and more support measures are expected.
Specifically, there is speculation that the Chinese government is considering reducing down-payments in some non-core neighbourhoods of major cities, lowering agent commissions on transactions, and relaxing restrictions for residential purchases.
The positives:
a. Domestic demand will be the shining light
China’s domestic demand has seen a mixed rebound over the first few months of this year.
Consumption recovery was driven primarily by a strong rebound in services spending on tourism, leisure, and restaurants, as the Chinese public cheered post-lockdown freedom by getting outdoors and travelling. The lock-down this time last year in Shanghai and some other cities boosted the year-on-year comparison.
Interestingly, the Dragon Boat Festival holidays in June saw holiday spending come in below pre-pandemic levels even though domestic tourism revenue was strong over the May Day holidays this year. While revenge spending in domestic tourism will decrease slightly over the coming months, it is still expected to remain elevated. Notably, China’s Tourism Academy predicts the number of domestic trips will hit approximately 4.6 billion this year, and domestic tourism revenue will hit around CNY4 trillion, representing a 95% year-on-year jump.
Overseas travel will take slightly longer to fully recover, as this requires more foreign flights to be added and visa application approvals to be ramped up.
On the surface, demand growth for goods appears sluggish as an uncertain economic backdrop deters many Chinese from big-ticket purchases. What needs to be highlighted is that China’s goods retail sales did not decline as much as services spending over 2022, hence the year-on-year growth does not seem as impressive.
We want to highlight one big advantage that China holds, and that is the record high Chinese Yuan deposits. As seen in Figure 9, China’s household savings have surged since the onset of COVID.
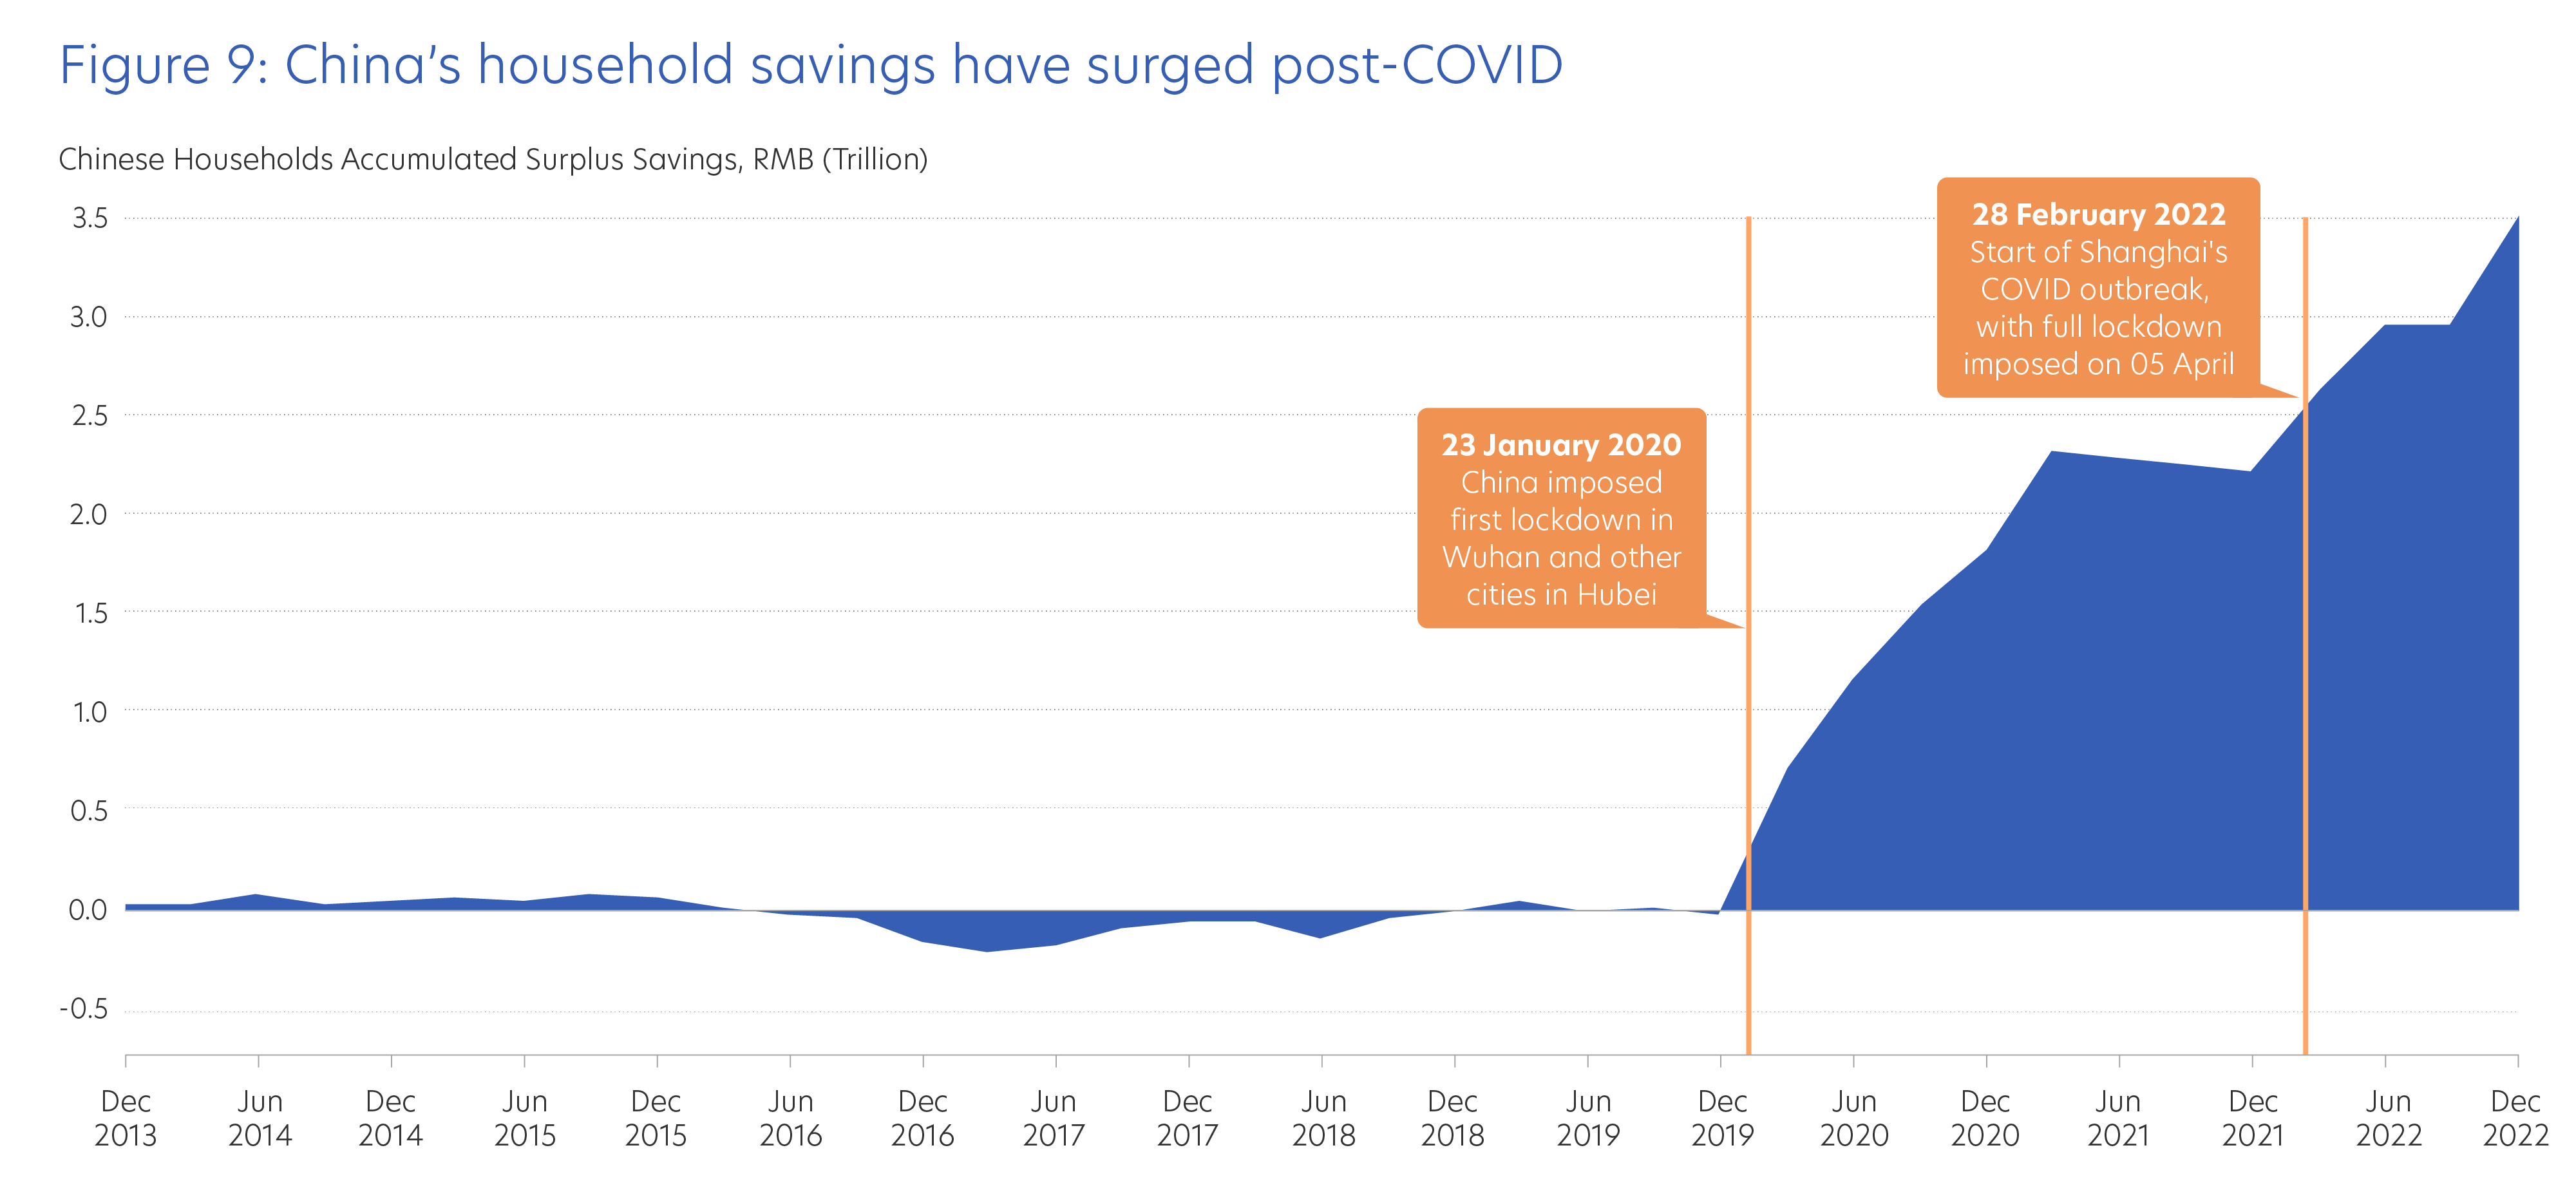
Source: JPMorgan Asset Management (30 June 2023).
China’s total Chinese Yuan deposits have hit a record high of nearly CNY275 trillion. To put things into context, this is more than triple the CNY84 trillion market capitalisation of the Chinese stock market. It is also more than double China’s 2022 nominal GDP of CNY121 trillion.
The build-up of Chinese Yuan deposits is positive in the longer run as businesses and households can unleash cash back into the economy via investments and spending. It is inevitable that those Chinese Yuan deposits will be deployed once people feel secure about the economic outlook, leading to a second phase of the domestic demand recovery.
b. China leading the way in green initiatives and renewable energy
Another area often overlooked is China’s active promotion of green initiatives and renewable energy over the past few years. China’s 14th Five-Year Plan has a target of 33% of electricity consumption coming from renewables by 2025, which they are on track to meet. China also aims to phase out internal combustion engine vehicles by 2035 and achieve net zero carbon emissions by 2060.
Notably, China has been leading the push into renewable energy technologies like solar, wind, hydroelectricity, and batteries, with the country leading the world in renewable energy production and renewable investments. Six out of the 10 largest EV battery makers in the world come from China. The market leader, Contemporary Amperex Technology Co. Ltd (CATL), commands a market share of 34% as at 2022, while Chinese battery companies account for 56% of total market share.
This matters as global sustainability is a long-term trend, and being at the forefront of the green movement, China has a big head-start in such technologies and would benefit from exponential surge in demand over the coming decades.
In addition, China has been making large-scale investments in clean-energy transition as it sees immense potential in green energy innovation as the next pillar of economic growth. This is expected to continue and has positive implications for China via jobs creation and exports.
c. Supportive fiscal and monetary policies
China’s political leaders have stuck to a pro-growth policy stance and vowed to keep monetary and fiscal policy supportive to combat economic headwinds.
An important takeaway is that unlike most other countries, China avoided large-scale fiscal or monetary stimulus during the COVID years and has the ability to unleash stimulus if economic recovery stalls.
This is made much easier by benign inflationary pressures. Consumer inflation is at a two-year low and producer prices have been in deflation for nine straight months.
Targeted monetary easing has already started. The first move was when Chinese authorities asked the country’s biggest banks to lower deposit rates. When bank deposit rates become less attractive, capital can be redirected into the stock market.
The People’s Bank of China (PBoC) has also cut its seven-day reverse repurchase rate![]() by 10bps to 1.9%, the first reduction since August 2022. In addition, the PBoC cut its 1-year medium-term lending facility (MLF) rate
by 10bps to 1.9%, the first reduction since August 2022. In addition, the PBoC cut its 1-year medium-term lending facility (MLF) rate![]() as well as its 1-year and 5-year loan prime rates (LPR)
as well as its 1-year and 5-year loan prime rates (LPR)![]() by 10bps each. This is an acknowledgement by the Chinese authorities that they need to do more to boost the faltering economic recovery.
by 10bps each. This is an acknowledgement by the Chinese authorities that they need to do more to boost the faltering economic recovery.
Looking ahead, we expect the PBoC to reduce its reserve requirement ratio (RRR)![]() to expand the low cost long-term funding source for banks. The PBoC still has the option to guide mortgage rates lower via the 5-year LPR if the recovery in the property market stalls.
to expand the low cost long-term funding source for banks. The PBoC still has the option to guide mortgage rates lower via the 5-year LPR if the recovery in the property market stalls.
In addition, it has been reported that China will announce new support measures to boost domestic demand and the real estate sector.
d. Private sector credit should deliver a positive boost
China’s credit growth started to reaccelerate at the start of this year, with bank loans leading the rebound. While this has turned negative in May, we expect this to be a brief blip. In general, overall credit growth should continue to expand over the coming months as the economy and housing market recovers. Credit growth is expected to peak in 4Q 2023 from low base effects.
Periods of accelerating credit growth have historically coincided with sustained rallies in Chinese stocks.
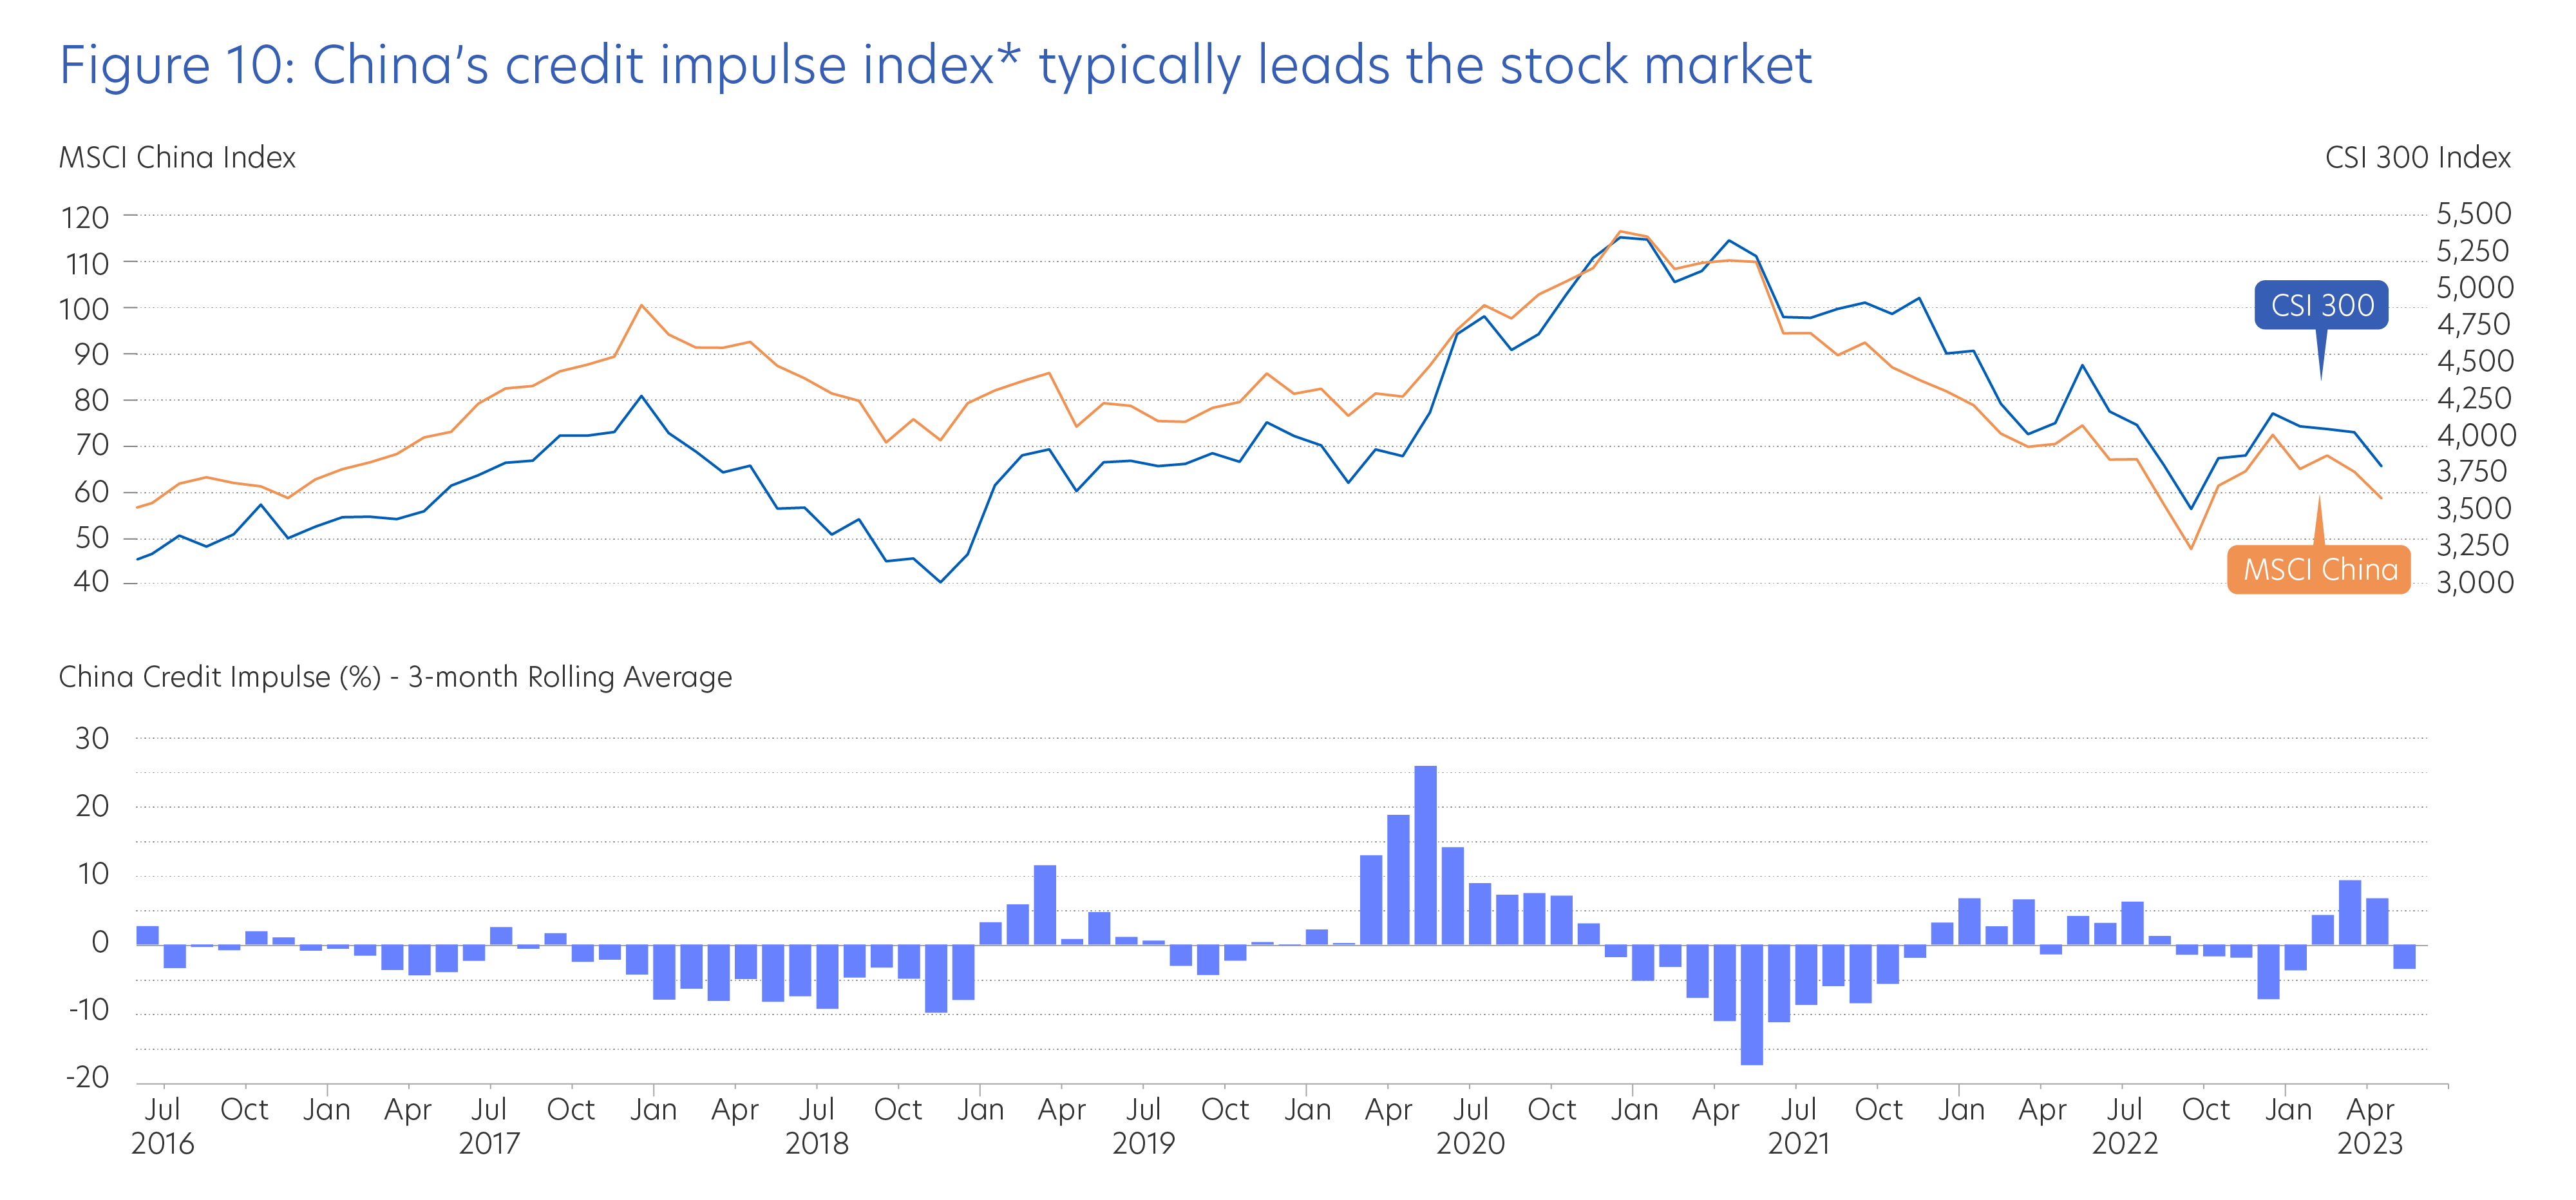
*The credit impulse index measures the change in new credit/bank lending as a percentage of GDP.
Source: UOB PFS Investment Strategists, Macrobond (30 June 2023).
Despite sluggish recovery, China remains our Top Idea
While China’s economic growth may disappoint in the short-term, we retain a positive outlook for the medium-term. China remains one of our Top Ideas as its economy should continue to outperform that of global peers.
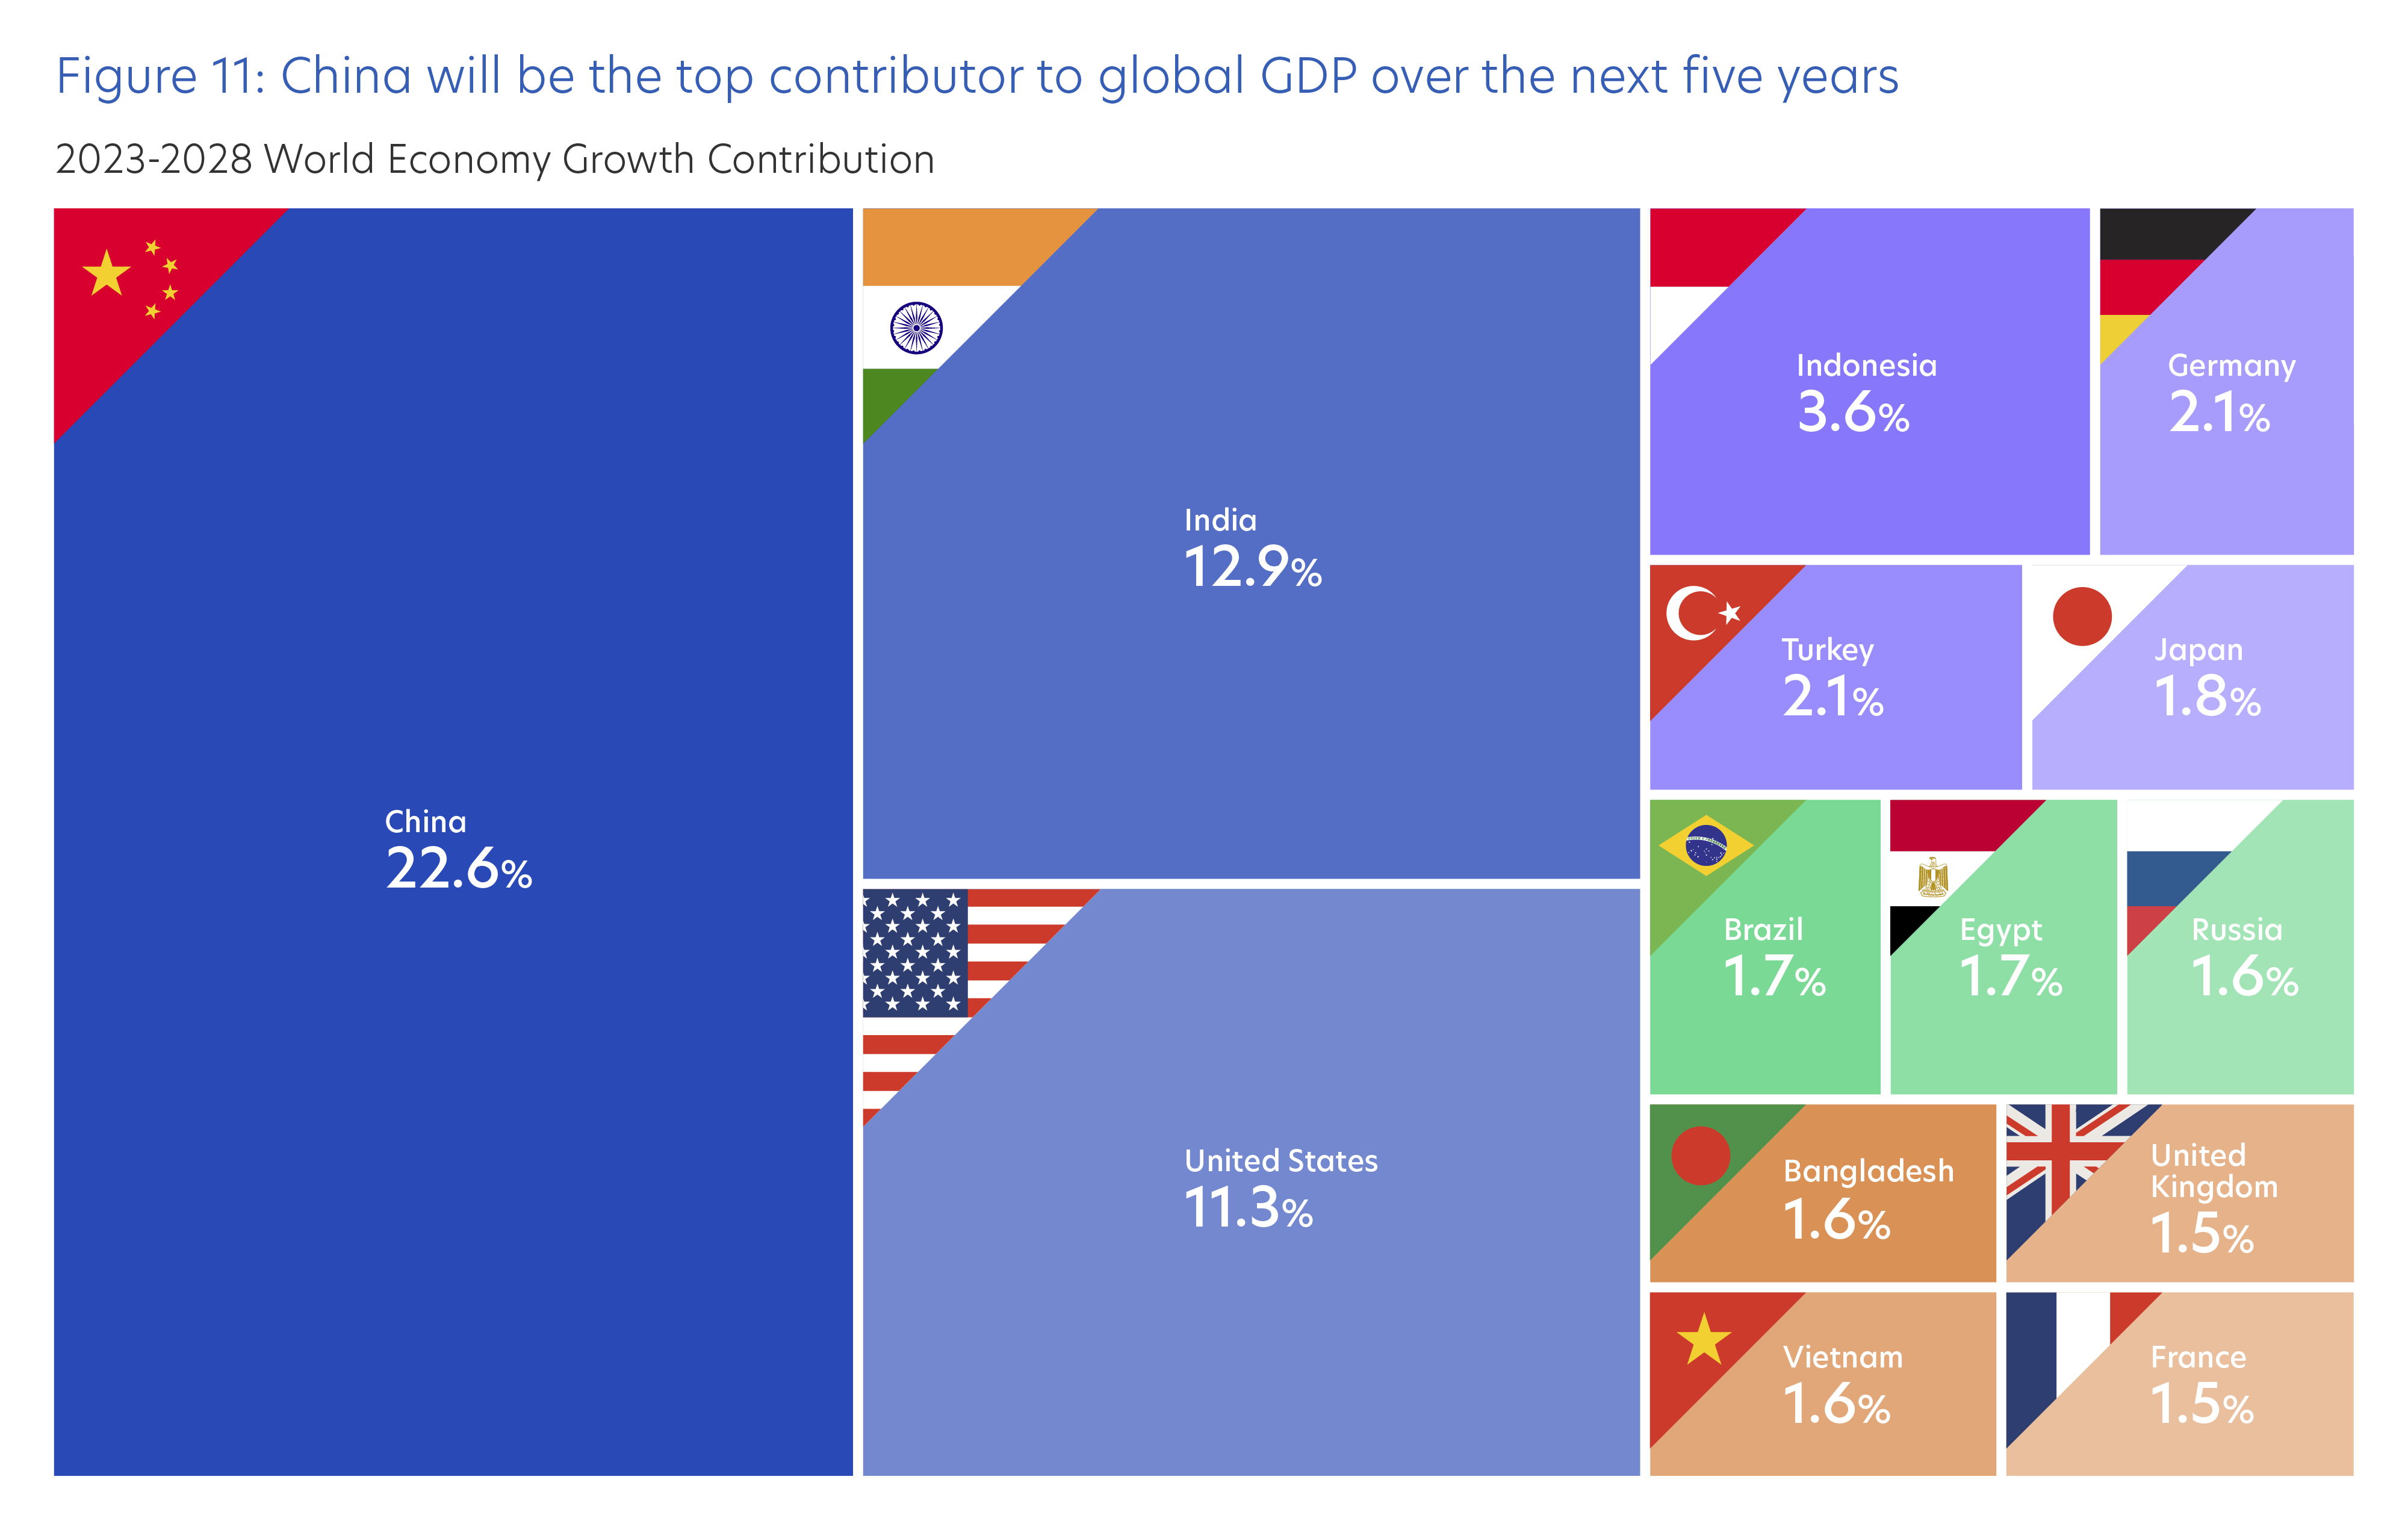
Looking at the IMF’s projections in Figure 11, China will be the top contributor to global growth over the next five years, with its share likely double that of the US. We maintain our China 2023 GDP forecast at 5.6%, above China’s official target of “around 5%”, taking into consideration 1Q 2023 GDP and low base of comparison.
Source: IMF, Bloomberg (30 June 2023).
In summary, more support measures for the property sector is expected, while high household savings mean domestic demand will be the key growth driver to offset external headwinds. A rebound in private sector credit is also expected to continue, and this will be positive for both the economy and Chinese stock markets. Lastly, China’s pro-growth policy stance provides a safety net, and the government can utilise targeted fiscal and monetary stimulus if required.
Chinese stock markets may underperform in the near-term and cause investors to lose faith. However, holding positions with a medium-term timeline can reap rewards given attractive valuations, supportive fiscal and monetary policies, and an eventual upturn in business and consumer sentiment.
4. AI: Potentially transformative, but longer-term impact still unclear
ChatGPT unleashed a frenzy over generative artificial intelligence (AI) when it was released to the public in November 2022.
With generative AI, users can perform tasks such as compose texts, graphics, art, and computer codes from scratch in a matter of seconds. Going forward, the technology could also help develop products, redesign business processes, and transform supply chains.
The myriad uses of generative AI have been discussed to be a game-changer for the global economy, even potentially fuelling a surge in labour productivity over the coming years. For example, the legal industry could use generative AI to design contracts and analyse evidence. Manufacturers could use the technology to identify defective parts and redesign processes. The medical industry can leverage on the technology to effectively identify promising drug candidates.
Goldman Sachs estimates generative AI could raise annual labour productivity growth by around 1.5% over a 10-year period following widescale adoption, with the possibility of increasing annual global GDP by 7.0% if the technology delivers![]() .
.
It is, however, unclear how this new technology will be implemented or evolve, and what regulations will be imposed to curb the risk of cybersecurity attacks, misinformation, and fake images or videos. How generative AI will be monetised in the future is also not yet defined.
We will also need to monitor how generative AI affects global labour markets, as Goldman Sachs estimates that roughly two-thirds of current jobs are exposed to some degree of AI automation. One quarter of jobs could also be eventually replaced, affecting around 300 million workers.
This may have a short-term impact of pushing up unemployment rates. However, displaced jobs could eventually be offset by new occupations that leverage on next generation technology, providing an economic boost from higher labour productivity and improved cost savings. For example, software programmers, webpage designers, and other tech roles have emerged since information technology innovations gathered pace in the 1980s, while 85% of employment growth since the 1940s have been driven by technology-driven new jobs.
Narrow breadth in AI stock rally, valuations are a concern
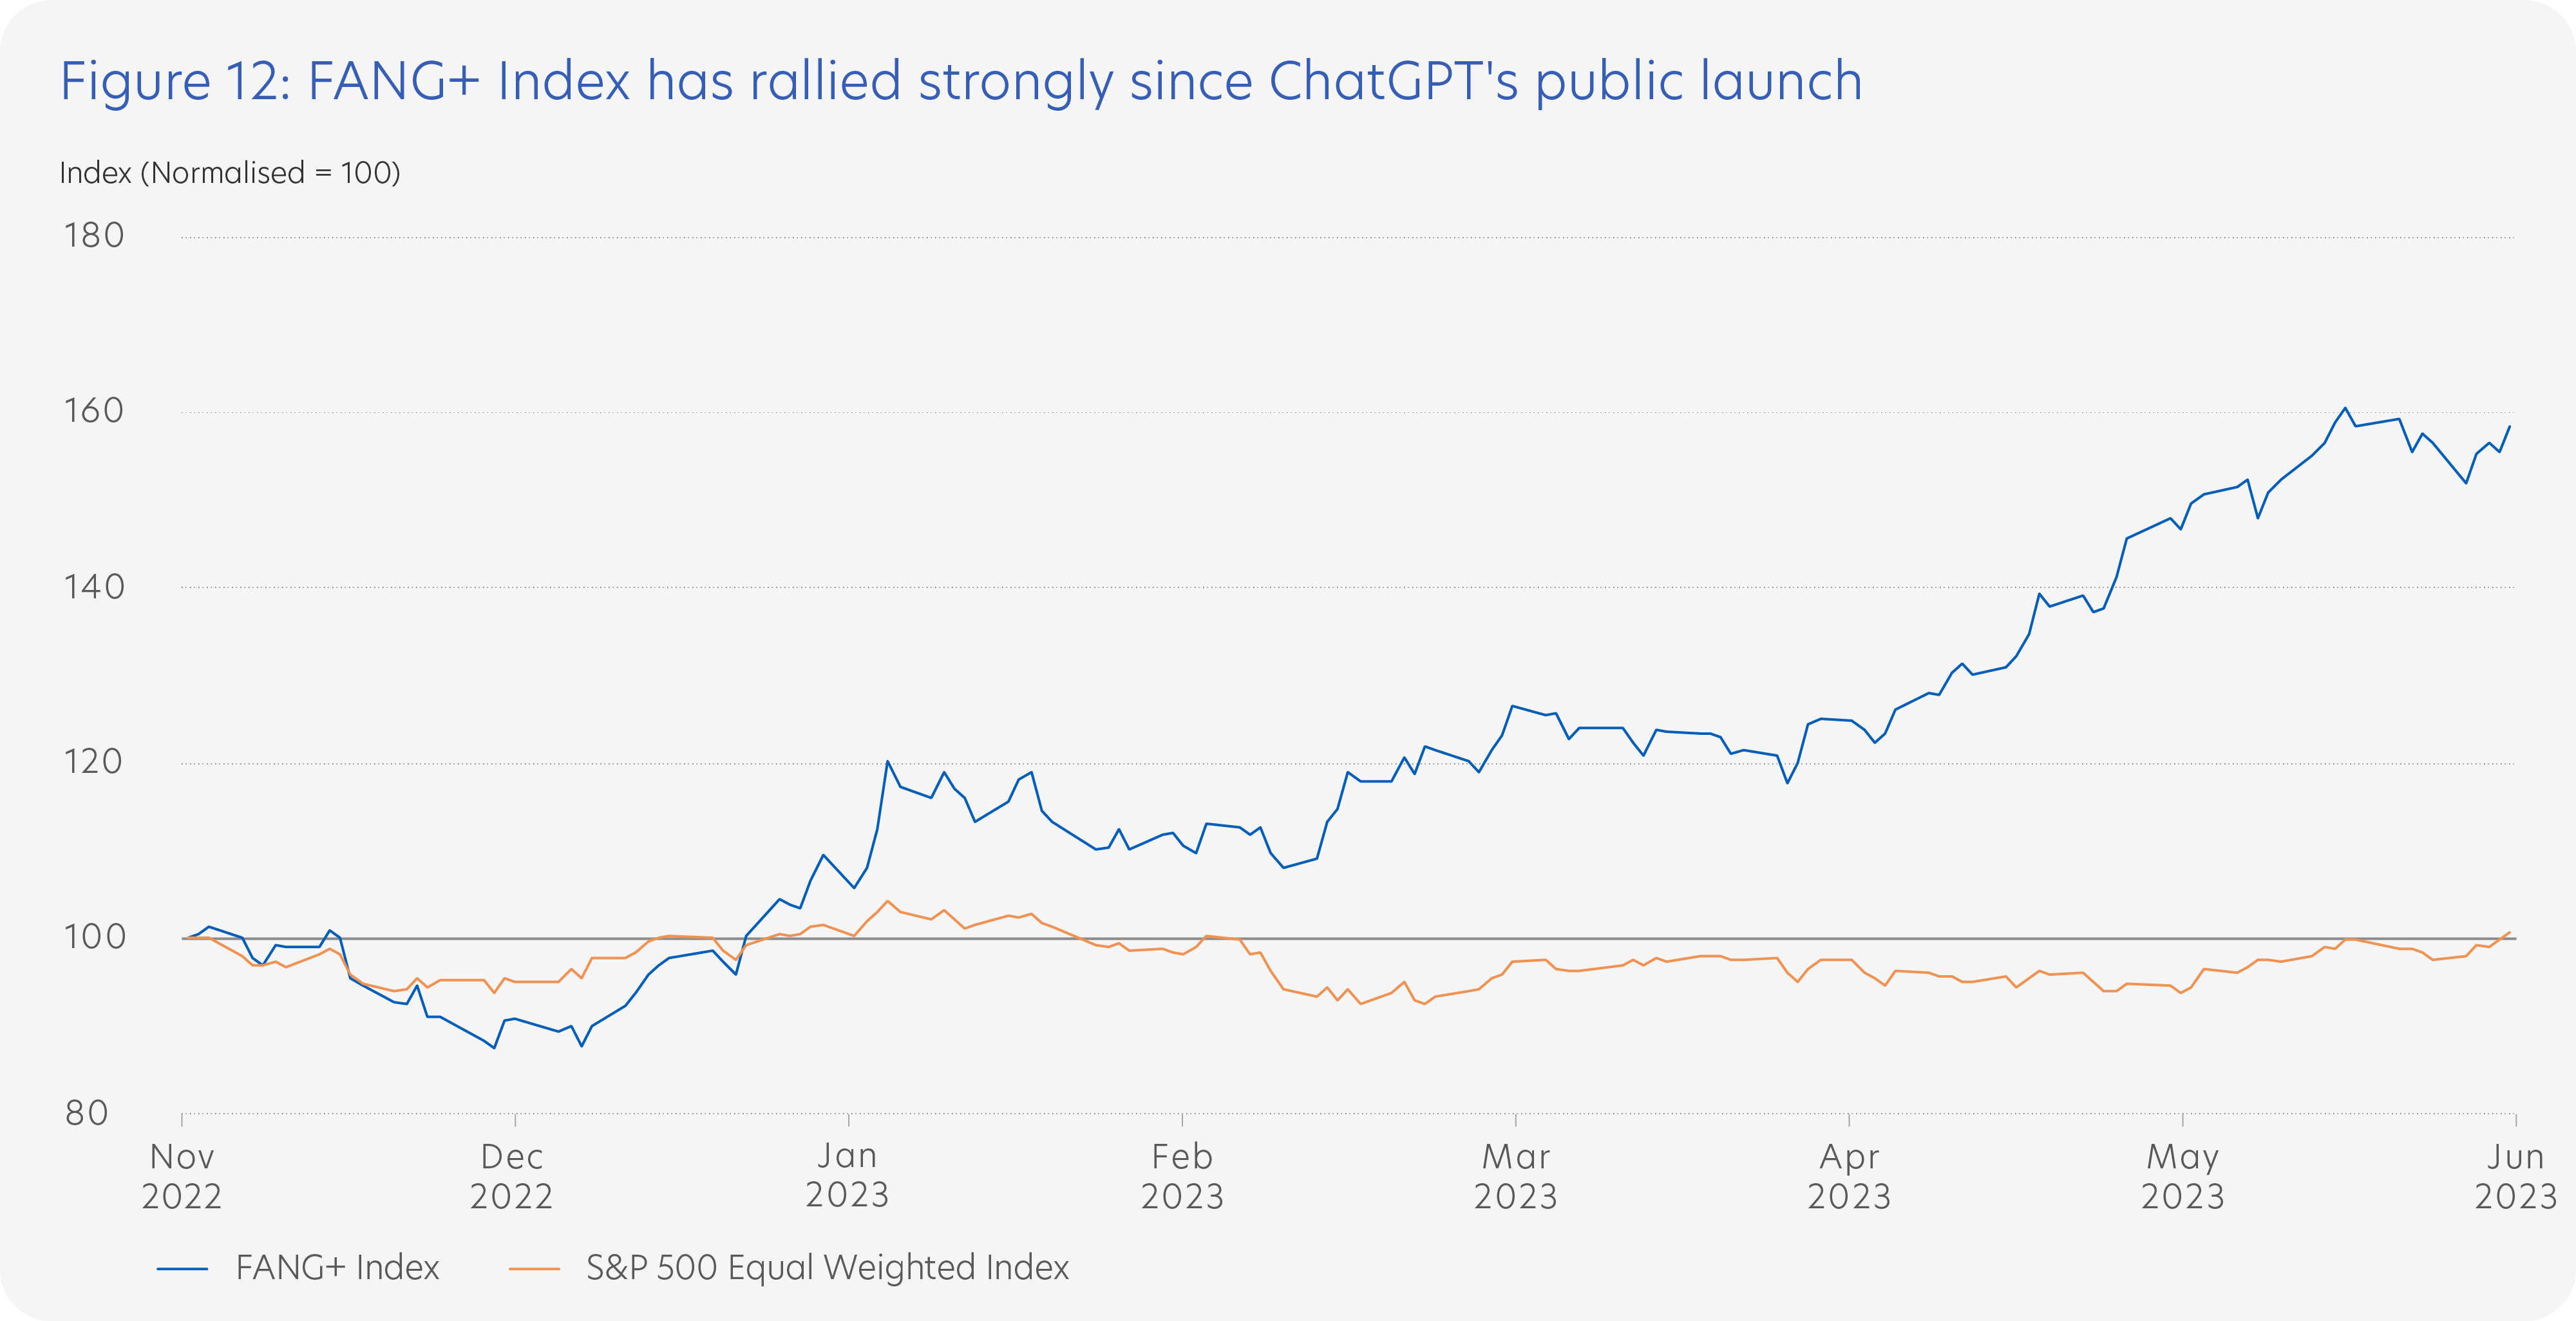
Financial market impact has been substantial. Recent hype drove a sharp rally for AI-related stocks on hopes of new revenue opportunities. The S&P 500 index gained 15.9% this year while the NASDAQ rallied an impressive 31.7%. However, the rally was driven by just a small number of big-tech stocks, with a large part of the rally triggered by the AI frenzy.
Figure 12 shows how the FANG+ Index of the top 10 traded tech stocks has outperformed the S&P 500 equal-weighted index since ChatGPT’s public launch on 30 November 2022.
Source: Bloomberg (30 June 2023).
Tech shares are infamous for overstretched rallies that defy fundamentals, and we do not rule out the possibility that positive momentum can drive AI-related stocks higher in the near-term.
It is debatable if this is a bubble, and there are valid arguments on both sides of the fence. Be cautious chasing the hype, as such a strategy may not deliver positive returns should markets turn.
While generative AI could be transformative over the coming years and decades, this rally looks overstretched in the short-term. Current valuations are lofty, with the NASDAQ 100, representing big-cap Tech stocks, trading at nearly 29 times forward earnings estimates compared to its historical average of 19.3 times, according to Bloomberg data.
Another area of concern is that the tech sector currently makes up 28.2% of the S&P 500 index. This is near levels seen in the 2021 COVID-era rally and not far from the 2000 tech bubble level of 33%. A steep sell-off cannot be ruled out should markets correct.
Notwithstanding short-term valuation concerns, the longer-term picture is positive for high-quality tech companies with proven technology that can benefit from AI. Such companies include those with stable revenues and cash flows, together with robust balance sheets. They are also less susceptible to interest rate risks and credit conditions, and their stocks are more resilient during market downturns.
As such, you could enjoy better risk-reward participating in this sector during corrections.
5. 60/40 portfolio remains relevant but requires a tweak
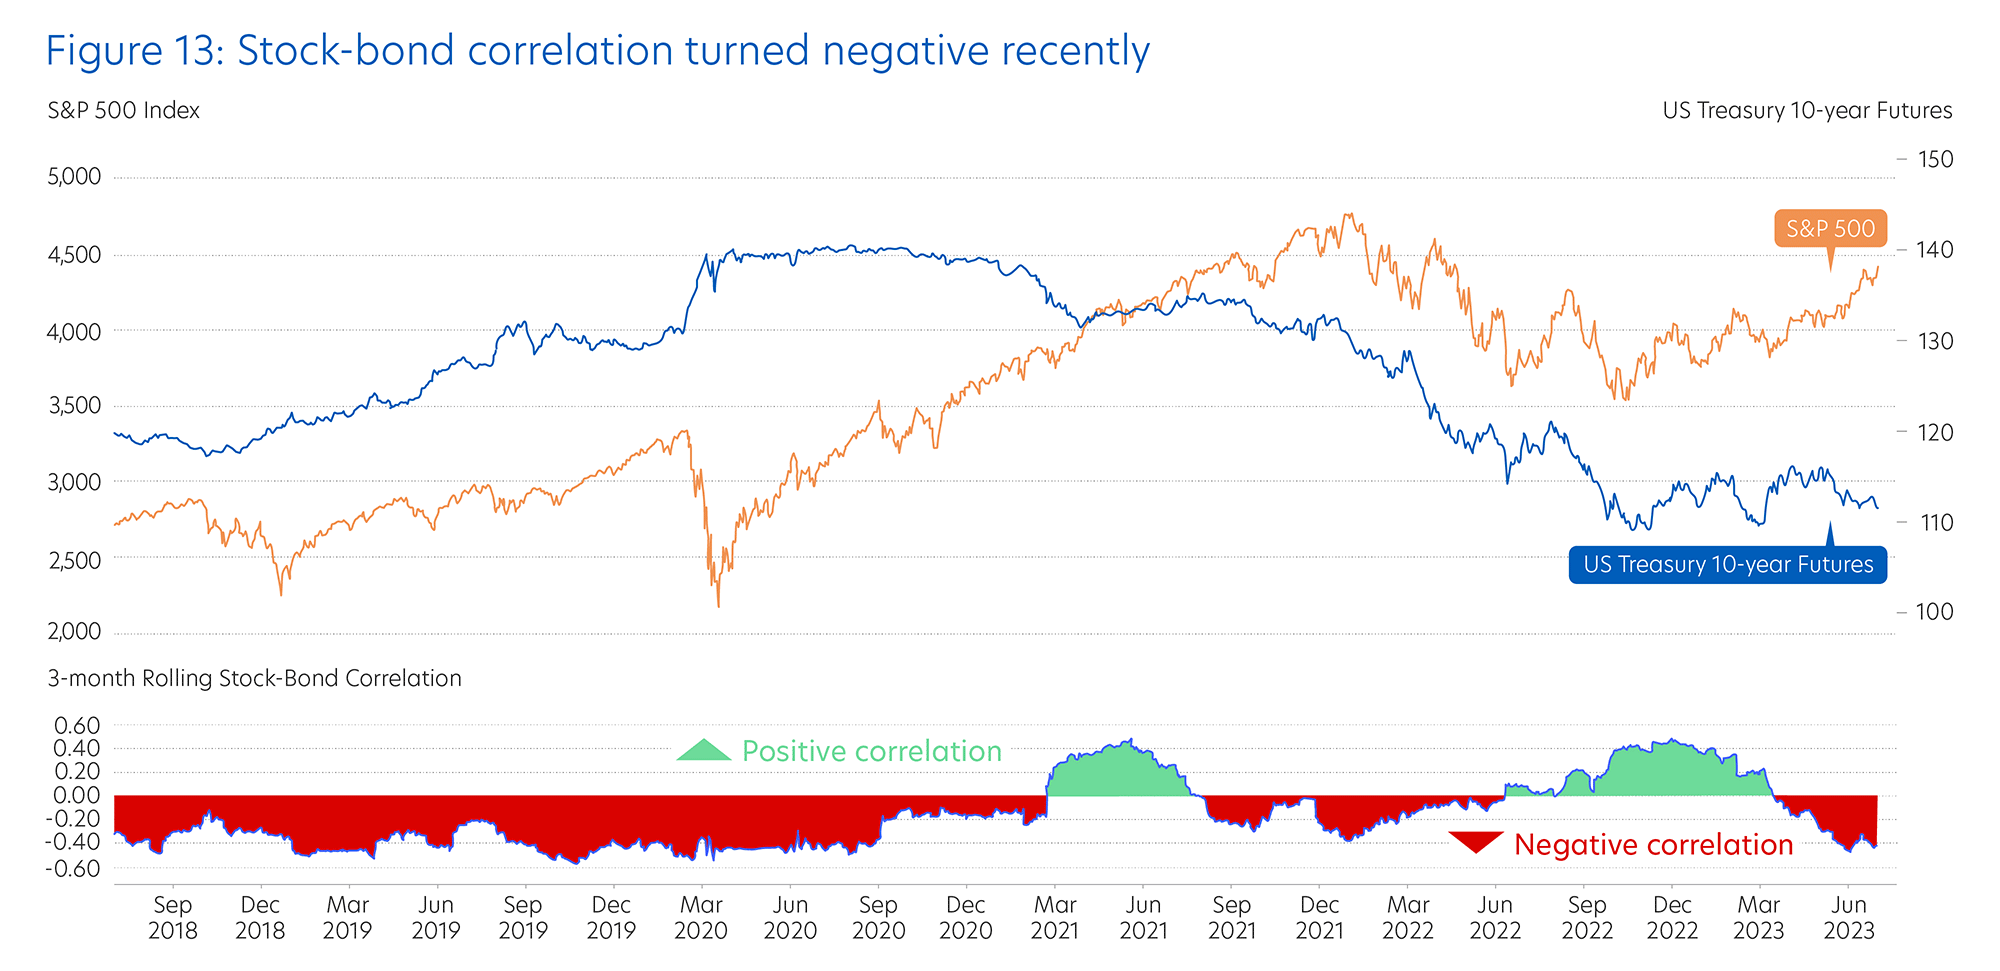
The stock bond correlation turned positive for a large part of 2022 when the Fed raised interest rates aggressively. Over the past few months, the correlation has turned negative as shown in Figure 13.
Source: Bloomberg (30 June 2023).
Whether the 60/40 portfolio remains relevant or should this concept be consigned to the bin comes up frequently, especially after the strategy suffered a -15.3% loss last year for its worst performance since 2008.
On one hand, some argue that 2022 was an aberration and that the 60/40 portfolio remains valid.
On the other hand, others have pronounced the 60/40 strategy outdated and irrelevant in an environment of high inflation and high interest rates.
The answer may well lie somewhere in the middle.
Fundamentally, the 60/40 portfolio remains relevant as diversification has shown to cushion portfolio losses. Bonds typically act as ballast within portfolios to offset potential losses in stock holdings when economic growth slows. Bond investors also potentially benefit from a pause in monetary tightening, something to be expected down the road as we are past peak inflation. Higher bond yields now also provide you with higher income.
Even if the stock-bond correlation turns positive down the road, this may not be a bad thing for you as stocks could be supported by a stronger economic outlook while bonds could be supported by a gradual disinflationary trend.
However, the 60/40 portfolio may need to be slightly tweaked to include inflation-hedged assets such as Gold, commodities, and inflation-linked bonds to account for a new era of higher price pressures.
Looking back at the 1970s and 2000s, these inflation-hedged assets significantly outperformed both stocks and bonds. Analysing Bloomberg data, Gold saw annualised real returns of 22% during the 1970s while stocks and bonds logged losses. Bloomberg data reveals that inflation-hedged bonds, Gold, and commodities outperformed significantly during the 2000s.
Hence, while a 60/40 portfolio remains relevant, you may want to explore taking a further step towards diversifying your investment portfolio.
Additional Resources
Contact a UOB Advisor
Download a digital copy
Credits
Credits
Managing Editor
- Winston Lim, CFA
Singapore and Regional Head,
Deposits and Wealth Management
Personal Financial Services
Editorial Team
- Abel Lim
Singapore Head,
Wealth Management
Advisory and Strategy - Michele Fong
Head, Wealth Advisory and Communications - Tan Jian Hui
Investment Strategist
Investment Strategy and Communications - Low Xian Li
Investment Strategist
Investment Strategy and Communications - Zack Tang
Investment Strategist
Investment Strategy and Communications - Nicholas Bryan Chia
Intern
UOB Personal Financial Services Investment Committee
- Singapore
- Abel Lim
- Ernest Low
- Michele Fong
- Tan Jian Hui
- Low Xian Li
- Zack Tang
- Jonathan Conley
- Alexandre Thoniel, CAIA
- Chen Xuan Wei, CFA
- Chia Hong Wei
- Daphne Chan
- Marcus Lee, CFTe, CMT
- Ivan Hu
-
Malaysia
- Ryan Tan
- Mow Wei Sern
- Thailand
- Suwiwan Hoysakul
- Boonnisaed Thanyaworaanan
- China
- Huang Li Li
- Indonesia
- Diendy
Important notice and disclaimers
The information contained herein is given on a general basis without obligation and is strictly for information purposes only. Such information is not intended to be, and should not be regarded as, an offer, recommendation, solicitation or advice to buy or sell any investment or insurance product and shall not be transmitted, disclosed, copied or relied upon by any person for whatever purpose. Any description of investment or insurance products, if any, is qualified in its entirety by the terms and conditions of the investment or insurance product and if applicable, the prospectus or constituting document of the investment or insurance product. Nothing contained herein constitutes accounting, legal, regulatory, tax, financial or other advice. If in doubt, you should consult your own professional advisers about issues discussed herein.
The information contained herein, including any data, projections and underlying assumptions, are based on certain assumptions, management forecasts and analysis of known information and reflects prevailing conditions as of the date of the publication, all of which are subject to change at any time without notice. Although every reasonable care has been taken to ensure the accuracy and objectivity of the information contained herein, United Overseas Bank (Malaysia) Bhd. (“UOB”) and its employees make no representation or warranty of any kind, express, implied or statutory, and shall not be responsible or liable for its completeness or accuracy. As such, UOB and its employees accept no liability for any error, inaccuracy, omission or any consequence or any loss/damage howsoever suffered by any person, arising from any reliance by any person on the views expressed or information contained herein.
Any opinions, projections and other forward looking statements contained herein regarding future events or performance of, including but not limited to, countries, markets or companies are not necessarily indicative of, and may differ from actual events or results. The information herein has no regard to the specific objectives, financial situation and particular needs of any specific person. Investors may wish to seek advice from an independent financial advisor before investing in any investment or insurance product. Should you choose not to seek such advice, you should consider whether the investment or insurance product in question is suitable for you.

We use cookies to improve and customise your browsing experience. You are deemed to have consented to our cookies policy if you continue browsing our site.